Why Choose Open Source Time Series Databases?
Open source time series databases eliminate vendor lock-in and licensing costs that commercial solutions impose. Organizations maintain full control over their monitoring infrastructure, customize implementations to specific requirements, and avoid unpredictable pricing based on data volume or host counts.
The transparency of open source code enables security audits and compliance verification. Teams can examine exactly how the database handles sensitive monitoring data, implement custom security controls, and ensure compliance with industry regulations. This visibility proves essential for organizations in heavily regulated industries.
Community-driven development accelerates innovation and bug fixes. Popular open source projects benefit from contributions by thousands of developers worldwide who identify issues, propose enhancements, and submit improvements. This collaborative model often delivers features faster than proprietary development cycles.
Operational flexibility allows deployment in any environment without restrictions. An open source time series database can run on-premises, in private clouds, or across multiple public cloud providers. This portability prevents cloud vendor lock-in and enables hybrid deployment strategies that optimize costs and performance.
Enterprise support options exist for teams requiring commercial backing. Many open source projects offer paid support tiers, managed services, and enterprise features while maintaining open source cores. This model provides the best of both worlds-open source flexibility with commercial reliability.
Evaluation Criteria: What Matters Most
Write performance determines whether a database can sustain required ingestion rates. Production monitoring systems generate millions of data points per second that databases must accept without dropping data. Measuring sustained write throughput under realistic workloads reveals capacity limits before deployment.
Query latency affects user experience for dashboards and alerting systems. Engineers expect subsecond response times for common queries and reasonable performance for complex analytical operations. Evaluating query performance across different patterns identifies systems that meet specific use case requirements.
Storage efficiency directly impacts infrastructure costs. Compression ratios determine how much disk space time series data consumes. Systems achieving 10:1 or better compression ratios dramatically reduce storage expenses compared to those with poor compression.
Operational complexity influences total cost of ownership beyond infrastructure costs. Databases requiring extensive tuning, frequent manual intervention, or specialized expertise increase operational burden. Systems with good defaults and automatic management features reduce staffing requirements.
Ecosystem integration determines how easily databases connect with existing monitoring tools. Native support for popular protocols like Prometheus, InfluxDB Line Protocol, or OpenTelemetry simplifies adoption. Compatibility with visualization tools like Grafana provides immediate value without custom development.
Scalability characteristics reveal whether systems handle growth gracefully. Evaluating both vertical scaling limits and horizontal scaling capabilities ensures the selected database supports future expansion. Understanding scaling boundaries prevents costly migrations later.
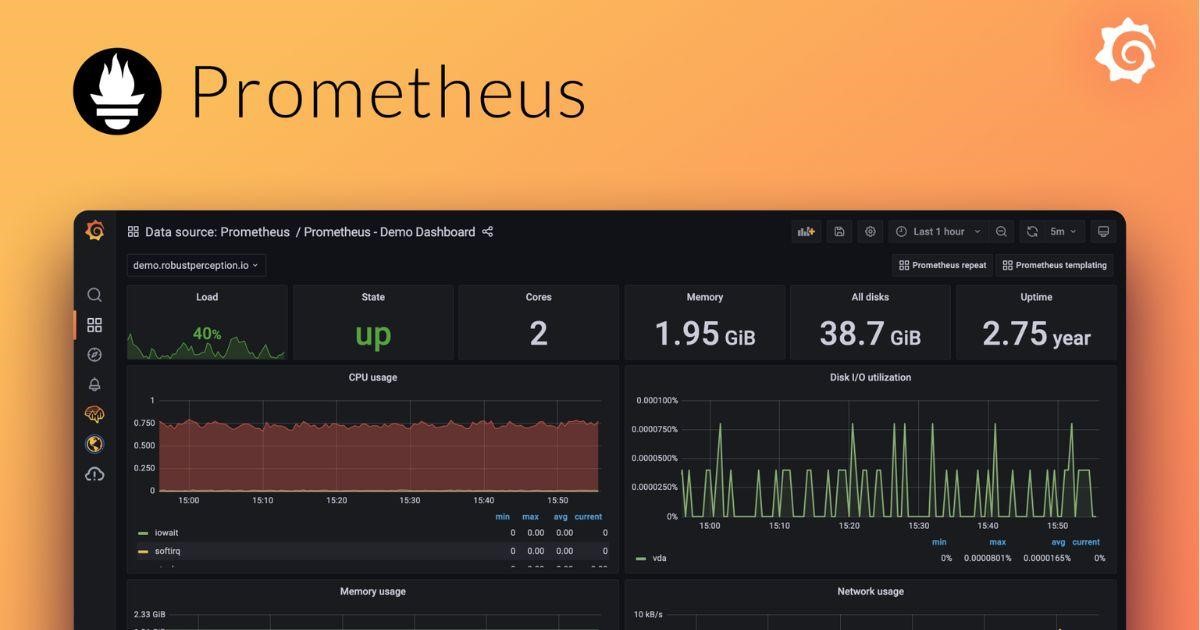
Prometheus: The Kubernetes Native Solution
Prometheus dominates Kubernetes monitoring through tight integration with container orchestration platforms. Native service discovery automatically identifies monitoring targets as pods scale, eliminating manual configuration. This automation makes Prometheus the de facto standard for Kubernetes environments.
The pull-based scraping model simplifies application instrumentation. Services expose metrics endpoints that Prometheus periodically scrapes. This design reduces complexity within applications since they don’t manage metric delivery or buffering.
PromQL provides a powerful query language specifically designed for time series analysis. The language supports complex aggregations, joins, and mathematical operations that enable sophisticated monitoring and alerting. However, PromQL requires learning a new syntax that differs from SQL.
Local storage in Prometheus limits retention capabilities and creates scaling challenges. The database stores data on local disk without native clustering support. Organizations requiring long-term retention typically integrate remote storage backends or federation architectures.
Alerting functionality integrates directly into Prometheus through Alertmanager. Rules evaluate PromQL expressions continuously and trigger notifications when conditions match. This built-in capability reduces the need for separate alerting infrastructure.
The vibrant ecosystem around Prometheus includes thousands of exporters for different systems. Community-maintained exporters provide metrics from databases, message queues, load balancers, and countless other components. This ecosystem coverage accelerates monitoring implementation.
InfluxDB: Features and Use Cases
InfluxDB offers a complete platform combining time series storage, visualization, and processing capabilities. The integrated approach simplifies deployment by reducing the number of components required for functional monitoring infrastructure. Version 3.0 represents a significant architectural evolution with improved performance.
SQL-like query syntax reduces learning curves for teams familiar with relational databases. While the language includes time-series-specific extensions, the familiar foundation accelerates adoption. This accessibility benefits organizations without specialized time series database expertise.
Built-in downsampling through continuous queries automatically aggregates data over time. Teams can define policies that compute hourly, daily, or monthly rollups from raw data. This automation manages retention and reduces storage consumption without manual intervention.
Clustering capabilities in commercial editions enable horizontal scaling. The open source version provides vertical scaling only, while paid tiers add clustering support. This limitation means organizations with extreme scale requirements must evaluate commercial offerings.
Tag indexing optimizes queries filtered by metadata labels. InfluxDB maintains inverted indexes mapping tags to time series, enabling fast lookups. However, high cardinality in tag combinations can degrade performance, requiring careful schema design.
The Flux query language introduces advanced data processing capabilities beyond traditional SQL. Flux enables complex transformations, joins across measurements, and integration with external data sources. This power comes with added complexity compared to simpler query languages.
TimescaleDB: PostgreSQL for Time Series
TimescaleDB extends PostgreSQL with time series optimizations while maintaining full SQL compatibility. This approach allows organizations to leverage existing PostgreSQL expertise, tools, and ecosystem. Applications can treat time series data like regular database tables without specialized client libraries.
Automatic partitioning through hypertables transparently shards data by time. TimescaleDB creates chunks covering specific time ranges and manages them automatically. This partitioning enables efficient data lifecycle management and query performance optimization.
Continuous aggregates maintain precomputed rollups that update automatically. Unlike materialized views that require manual refresh, continuous aggregates update incrementally as new data arrives. This capability provides fast query performance for common aggregations without manual maintenance.
Compression policies reduce storage consumption by applying columnar compression to older data. The compression engine achieves significant space savings while maintaining queryability. This hybrid approach balances write performance for recent data with storage efficiency for historical data.
The PostgreSQL foundation provides enterprise-grade reliability features. ACID transactions, replication, point-in-time recovery, and decades of production hardening make TimescaleDB suitable for mission-critical applications. Organizations with strict reliability requirements benefit from this mature foundation.
Relational join capabilities enable combining time series data with reference tables. This functionality supports use cases like enriching metrics with metadata from other systems or correlating time series with business data. Native joins eliminate the need for application-layer data merging.
VictoriaMetrics: High Performance at Scale
VictoriaMetrics delivers exceptional performance and storage efficiency optimized for large-scale deployments. The database achieves ingestion rates exceeding tens of millions of data points per second on commodity hardware. This performance makes it attractive for organizations with demanding monitoring requirements.
Storage compression in VictoriaMetrics often achieves ratios of 70:1 or better on real-world data. The aggressive compression algorithms reduce infrastructure costs significantly compared to alternatives. Lower storage requirements directly translate to reduced operational expenses.
Prometheus compatibility enables seamless migration from Prometheus deployments. VictoriaMetrics supports the Prometheus remote write protocol and PromQL query language. Organizations can replace Prometheus storage while maintaining existing dashboards, alerts, and integrations.
The open source time series database provides both single-node and clustered deployment options. Single-node installations simplify operations for moderate scale, while clusters support horizontal scaling to handle massive workloads. This flexibility accommodates diverse organizational needs.
MetricsQL extends PromQL with additional functionality for complex analysis. While maintaining PromQL compatibility, MetricsQL adds functions for statistical analysis, anomaly detection, and advanced transformations. These extensions enable sophisticated queries without requiring external processing.
Operational simplicity distinguishes VictoriaMetrics from more complex alternatives. The database requires minimal tuning and performs well with default configurations. This ease of operation reduces the expertise needed for successful deployment and ongoing management.
Graphite: The Veteran Monitoring Solution
Graphite pioneered time series monitoring for infrastructure and applications over a decade ago. The project’s maturity means proven stability in production environments and extensive documentation based on years of operational experience. Many organizations continue running Graphite successfully for their monitoring needs.
Simple data model using dot-separated metric names provides intuitive organization. Metrics follow hierarchical naming schemes like servers.web01.cpu.usage that naturally represent infrastructure topology. This simplicity accelerates initial implementation though it lacks the flexibility of label-based systems.
Whisper storage files use fixed-size databases that prevent unbounded growth. Each metric gets a dedicated file with predefined retention policies and resolution levels. While this approach simplifies capacity planning, it lacks the flexibility and compression efficiency of modern alternatives.
The Carbon daemon handles metric ingestion through a straightforward protocol. Applications send metrics via simple text or pickle protocols over TCP or UDP. This protocol simplicity means easy integration with virtually any programming language or monitoring tool.
Render API provides HTTP endpoints for querying and visualizing metrics. Built-in rendering capabilities generate graphs directly, though most deployments use Graphite as a backend for Grafana. The API supports complex functions for data transformation and aggregation.
Limited scalability compared to modern alternatives stems from Graphite’s age. While clustering is possible through tools like Carbon Relay, native clustering support lags behind newer databases. Organizations with massive scale requirements typically migrate to more modern solutions.
The storage engine organizes data into time-sharded blocks or chunks. Each block covers a specific time range and contains compressed data for multiple metrics. This organization enables efficient pruning during queries-the database can skip entire blocks that fall outside the requested time window. Similarly, just as TSDBs optimize data access for efficiency, websites can optimize their content structure and search visibility using professional SEO services in London.
OpenTSDB: Built on HBase
OpenTSDB leverages HBase for distributed storage and scalability. This architecture provides strong horizontal scaling capabilities and handles massive datasets effectively. Organizations already running HBase infrastructure can reuse that investment for time series storage.
Tag-based data model enables flexible querying by metadata labels. Unlike Graphite’s hierarchical naming, OpenTSDB associates arbitrary key-value tags with each metric. This flexibility supports complex filtering and grouping operations during queries.
Write performance scales linearly by adding HBase region servers. The distributed architecture spreads ingestion load across cluster nodes, enabling sustained high write rates. This scalability supports use cases generating hundreds of millions of data points per second.
Query performance depends heavily on tag cardinality and HBase tuning. High-cardinality tags can create hotspots that degrade performance. Proper schema design and HBase configuration prove critical for maintaining acceptable query latency.
Operational complexity increases due to HBase dependencies. Teams must manage and tune both OpenTSDB and the underlying HBase cluster. This operational overhead requires expertise in both systems and increases management burden.
The active community continues developing OpenTSDB though momentum has shifted toward newer alternatives. While the project remains maintained, innovation pace lags behind more actively developed databases. Organizations should consider whether the community trajectory aligns with long-term requirements.
Performance Benchmarks: Speed and Scalability
Write throughput comparisons reveal capacity limits for different databases. VictoriaMetrics typically leads in raw ingestion rates, followed by InfluxDB and Prometheus. TimescaleDB performs well though PostgreSQL’s overhead introduces some limitations compared to specialized systems.
Query latency varies significantly based on data patterns and query complexity. Prometheus excels at simple range queries but struggles with high-cardinality aggregations. TimescaleDB’s SQL engine handles complex analytical queries efficiently. VictoriaMetrics balances good performance across diverse query patterns.
Concurrent query handling affects dashboard and alerting responsiveness. Systems must serve multiple simultaneous queries without performance degradation. Databases with poor concurrency control experience query queueing that impacts user experience.
Memory requirements influence deployment costs and sizing decisions. Prometheus and VictoriaMetrics maintain large in-memory indexes that demand substantial RAM. TimescaleDB leverages PostgreSQL’s mature memory management. Understanding memory profiles prevents undersizing that causes performance issues.
Network bandwidth consumption impacts distributed deployments. Clustered databases generate substantial inter-node traffic for replication and query coordination. Measuring network overhead ensures infrastructure can support communication requirements.
Storage Efficiency and Cost Comparison
Compression ratios directly determine storage costs across implementations. VictoriaMetrics achieves the best compression, often exceeding 70:1 on real-world monitoring data. InfluxDB and TimescaleDB typically deliver 10:1 to 20:1 compression. Prometheus provides moderate compression around 5:1 to 10:1.
Storage overhead beyond raw data includes indexes, metadata, and operational files. Some systems require substantial space for indexes that enable fast querying. Understanding total storage requirements beyond compressed data prevents capacity surprises.
Write amplification affects storage longevity and performance. Systems that rewrite data during compaction or organization create additional disk wear. Solid-state drives particularly suffer from excessive write amplification, potentially reducing hardware lifespan.
Downsampling capabilities reduce long-term storage requirements. Databases supporting automatic aggregation of historical data maintain analytical value while discarding raw samples. This functionality proves essential for cost-effective long-term retention.
Storage backend flexibility enables optimization for different use cases. Systems supporting object storage integration can leverage extremely cheap cloud storage for historical data. This tiering dramatically reduces costs for retaining data beyond immediate operational needs.
Community Support and Ecosystem
Community size indicates project health and available resources for troubleshooting. Prometheus boasts the largest community with extensive documentation, tutorials, and third-party integrations. This ecosystem maturity accelerates problem resolution and reduces implementation risk.
Integration availability with visualization and alerting tools matters for practical deployments. All major open source time series databases integrate with Grafana for visualization. Native support for common protocols reduces integration effort and maintains compatibility across tools.
Client library support across programming languages affects application instrumentation ease. Well-maintained libraries for popular languages simplify metric emission from applications. Comprehensive language support ensures monitoring doesn’t dictate technology choices.
Cloud provider integrations streamline deployment in public cloud environments. Managed services for Prometheus, InfluxDB, and TimescaleDB exist across major cloud providers. These managed offerings reduce operational burden though they introduce vendor dependencies.
Commercial support availability provides options for organizations requiring SLAs and guaranteed responses. Companies behind Prometheus, InfluxDB, TimescaleDB, and VictoriaMetrics all offer commercial support tiers. This backing reassures enterprises deploying open source software.
Choosing the Best Open Source Time Series Database
Kubernetes-native deployments naturally gravitate toward Prometheus due to tight integration and service discovery. Organizations invested in Kubernetes ecosystems benefit from Prometheus’s first-class support and extensive community knowledge.
PostgreSQL expertise makes TimescaleDB attractive for teams already running PostgreSQL infrastructure. Leveraging existing operational knowledge reduces learning curves and reuses established practices for backup, replication, and high availability.
Extreme scale requirements favor VictoriaMetrics for its exceptional performance and compression. Organizations generating millions of metrics per second benefit from efficient resource utilization that reduces infrastructure costs.
SQL familiarity and relational joins point toward TimescaleDB or InfluxDB for teams preferring standard query languages. The reduced learning curve accelerates productivity compared to specialized query languages.
Simple deployment and minimal operational overhead make VictoriaMetrics or Prometheus suitable for small teams. Both provide good out-of-box experiences with minimal tuning required for production readiness.
The best choice depends on specific organizational context including existing expertise, scale requirements, budget constraints, and operational preferences. Evaluating databases against actual workloads through proof-of-concept testing reveals practical suitability better than theoretical comparisons.
Read More: Finding Relief in the City That Never Sleeps: Advanced Migraine Treatment in NYC